Learning Greek (for Options)
The Greeks & Probabilities: The Invisible Forces Behind Options Trading

Why You Need the Greeks (Even If You Hate Math)

Most people think options are complicated because of the Greeks.
The truth? Greeks aren’t math—they’re gut feelings expressed numerically.
You already understand them intuitively:
“This stock is moving a lot lately.” → Implied Volatility (Vega)
“I want the price to move up quickly.” → Delta
“Time decay is killing my trade.” → Theta
“My option exploded on a small move!” → Gamma
Once you understand these forces, strategies like the Wheel, credit spreads, and earnings volatility suddenly make sense.
The Shop Owner Story

Remember our teaware shop analogy? Let’s add a twist:
You run a tea shop (selling teas and pots).
Your scout calls you every morning with a “forecast”:
“Expect stable market prices today. It is off season.”
“Storm coming—prices may swing.”
“Time is short—options decay faster now.”
“A small move could have a big effect.”
That scout’s updates are the Greeks—they tell you how sensitive your options are before things happen.
Learning Outcomes

After this lesson, you’ll be able to:
Understand Delta, Gamma, Vega, Theta, and Rho in plain language.
Know which Greeks matter for Wheel trades.
Choose strikes intentionally, not randomly.
Understand how implied volatility affects pricing.
See why high-IV trades are both opportunity and risk.
The Greeks Explained
1. Delta — “Direction and Likelihood”
Measures how much your option moves when the stock moves.
it’s an approximation that varies with moneyness, IV, and time.
Definition: The rate of change of an option’s price with respect to the price of the underlying asset; formally, the first partial derivative of the option value with respect to the underlying price.
Roughly indicates probability of finishing ITM.
Wheel tip: For Cash Secured Puts (CSPs) or Covered Calls (CC), Delta 0.15–0.30 = safe yield, moderate assignment risk. The higher the delta, the higher the assignment risk. You decide according to your own style of trading if you are looking for assignment or not. Delta will help you get the right strike based on your objectives.
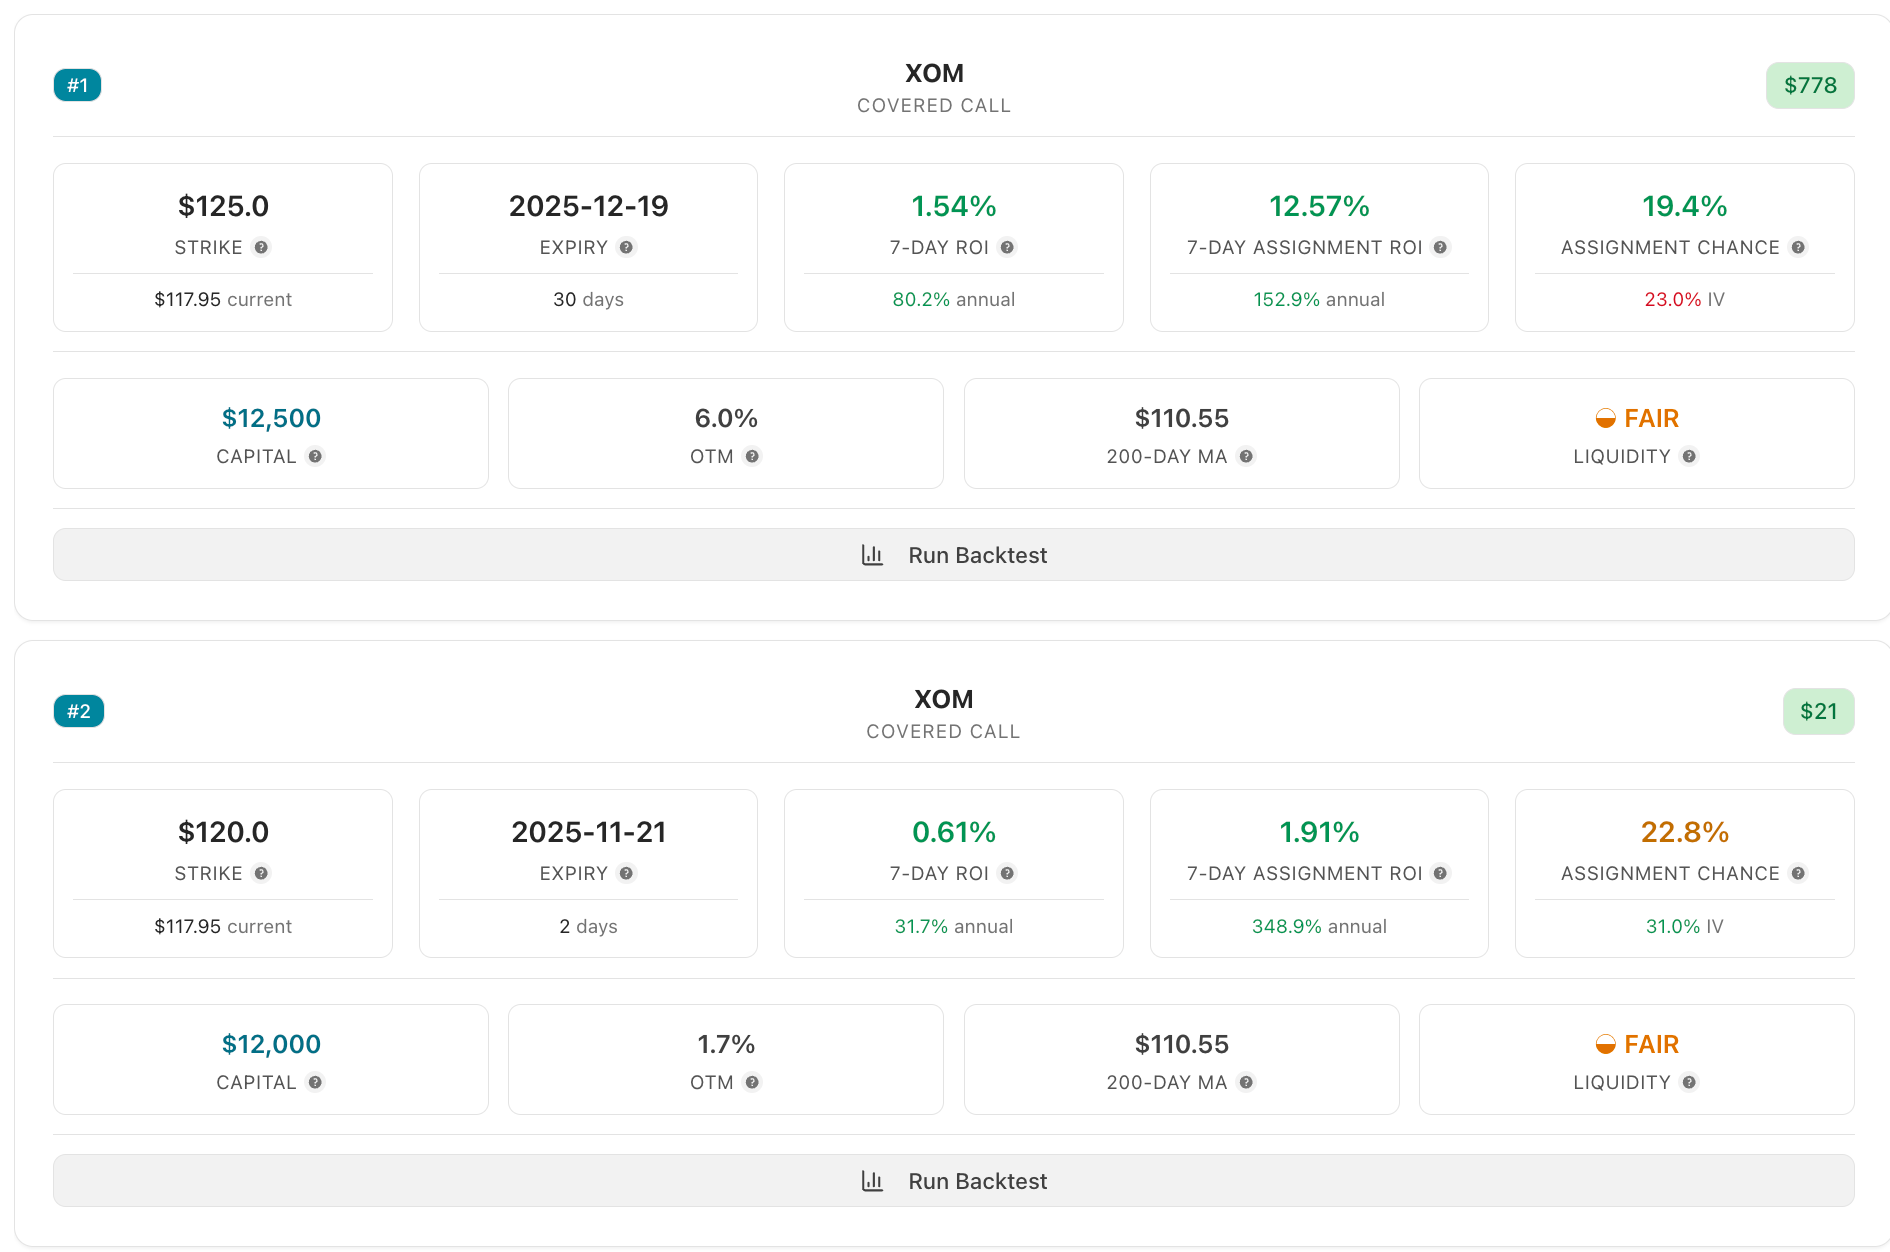
Probability of Profit (POP) is something you often see on your trading brokerage applications before entering or during a trade. For a cash‑secured put, it is the chance you end profitable at expiration. It collapses when the underlying makes a sustained, large downward move so that finishing above your break‑even becomes very unlikely.
Key drivers that push POP toward 0:
Price: A fast drop well below the strike − premium (your break‑even). The deeper below, the lower POP.
Time: As days pass with price still below break‑even, there’s less runway for recovery, so POP decays.
Volatility: A spike in IV raises put prices (against you) and widens expected downside; model POP shrinks.
Gamma near expiry: If the put sits ATM/ITM close to expiration, Delta races toward −1, making further drops crush POP quickly.
Events: Dividends, earnings, or macro shocks that gap the stock down can instantaneously slash POP.
Mental model: For a put with strike 100 and $2 premium (break‑even 98), a slide to 92 with 3 days left and high IV implies very low probability of finishing at or above 98; POP approaches zero unless price mean‑reverts sharply before expiration.
2. Gamma — “How Fast Delta Changes”
Measures the rate at which Delta accelerates when the underlying changes in price.
Definition: The rate of change of Delta with respect to the underlying asset’s price; formally, the second partial derivative of the option value with respect to the underlying price.
High Gamma → quick changes in your exposure.
Concrete Gamma example
You’re short a 7‑day cash‑secured put on XOM at strike 100 when XOM trades 100.
Starting Greeks: Delta ≈ −0.50, Gamma ≈ 0.10 per $1, Theta positive (you collect decay), Vega moderate.
Now price ticks up to 101.
Delta update: Delta moves from −0.50 toward −0.40 because Gamma adds about +0.10 to Delta for a $1 move.
Effect: Your short put’s directional risk drops quickly; Probability of Profit (POP) improves, and the option price falls more than you’d expect from Delta alone.
Price instead ticks down to 99.
Delta update: Delta moves from −0.50 toward −0.60 (Gamma subtracts ~0.10 for a $1 drop).
Effect: Risk ramps fast near ATM close to expiry; the option gains value sharply against you.
Why this matters: With only 7 days left and the option ATM, Gamma is high, so tiny price moves cause Delta to swing. This is why managing near‑expiration ATM positions is critical: your exposure can change faster than your intuition based on a static Delta.
Wheel tip: Watch Gamma when CSPs are near ATM close to expiration. Should not be a worry if not leveraged, and happy to hold underlying for the long term.
3. Theta — “Time Decay / Rent You Collect”
Theta = premium you earn (if selling) or pay (if buying). Tick Tock Theta.
Definition: The rate of change of an option’s price with respect to the passage of time, holding other inputs constant; formally, the partial derivative of the option value with respect to time (often expressed per day).
Concrete Theta example
You’re short a 7‑day cash‑secured put on XOM at strike 100 when XOM trades 100. The option’s quoted Theta is about −0.05 per day for the buyer, which is +0.05 per day for you as the seller.
Day 1, price unchanged at 100: the option’s extrinsic value drops by roughly $0.05 purely from time passing.
Day 2, still 100: another ~$0.05 decay. Cumulatively, about $0.10 has decayed even with no price or IV change.
Final 2–3 days: Theta accelerates; the daily decay might rise toward ~$0.07–$0.10 per day at-the-money, so your premium erodes faster as expiration approaches.
Why this matters: Theta benefits option sellers when the underlying and IV stay stable, but the effect can be overwhelmed by price moves or IV spikes. Near expiration and at-the-money, the “rent you collect” from time decay is strongest, which is why Wheel trades often target shorter durations.
Decay accelerates as expiration nears.
Wheel tip: Your income engine—collecting time decay systematically.

4. Vega — “Volatility Sensitivity”
Measures how options react to changes in implied volatility.
Definition: The rate of change of an option’s price with respect to the underlying’s implied volatility; formally, the partial derivative of the option value with respect to volatility. Note: “Vega” is conventional but not a Greek letter.
Concrete Vega example
You’re short a 7‑day cash‑secured put on XOM, strike 100, with XOM at 100. The option shows Vega ≈ 0.04. That means for each 1 percentage point change in implied volatility (IV), the option’s price changes by about $0.04.
IV rises 5 points (e.g., 25% → 30%) with price unchanged:
Option value increases by roughly $0.20 (0.04 × 5). As the seller, that move is against you because the premium inflates when IV climbs.
IV falls 5 points (e.g., post‑earnings IV crush: 30% → 25%) with price unchanged:
Option value drops by about $0.20. As the seller, that helps you: premiums deflate and you can buy back cheaper.
Why this matters: Near events (earnings, macro announcements), IV can jump or collapse even without price movement. Short‑dated, at‑the‑money options typically have meaningful Vega; selling premium into high IV captures more extrinsic value but exposes you to adverse IV expansions before the crush. Pair this with your Delta/Gamma view so you’re not surprised if price and IV move together.
Implied volatility is the market’s forecast of future price variability.
Implied volatility is the volatility figure backed out from current option prices using a pricing model like Black‑Scholes‑Merton. It reflects traders’ collective expectations of how much the underlying will move over the option’s life, not what has happened historically. Higher implied volatility means richer premiums; lower implied volatility means cheaper options.
Higher IV → options are more expensive.
Wheel tip: Sell puts/calls when IV is high to get paid more; avoid selling in low IV.
Storms on the horizon: Insurance premiums rise

5. Rho — “Interest Rate Sensitivity”
Interest rate related. Minor for short-dated options.
Definition: The rate of change of an option’s price with respect to the risk‑free interest rate; formally, the partial derivative of the option value with respect to the interest rate.
Concrete Rho example (1‑year OTM LEAPS)
You buy a 1‑year out‑of‑the‑money call on XOM, strike 120, with XOM at 100. Because it’s long‑dated, the option has meaningful Rho ≈ +0.30. That means for each 1 percentage point increase in the risk‑free rate, the call’s price rises about $0.30; a 1‑point decrease lowers it by ~$0.30, holding price and IV constant.
Rate hike scenario: Risk‑free rate moves from 4% to 5% (+1 pp).
Call value increases by roughly $0.30 from Rho alone. Intuition: higher rates raise the present value benefit of deferring payment for the stock, so calls gain.
Rate cut scenario: 5% to 4% (−1 pp).
Call value decreases by about $0.30. Intuition: lower rates reduce that carry benefit, so calls lose; conversely, long‑dated puts with Rho ≈ −0.30 gain about $0.30 when rates fall.
Why this matters for LEAPS: Rho grows with time to expiration and matters more when options are OTM and have substantial extrinsic value. For a barbell approach—bullion + long LEAPS—macro rate shifts can move LEAPS prices even without changes in stock price or implied volatility. Manage exposure by noting Rho alongside Delta/Vega when central bank moves are likely.
Matters for LEAPS or large portfolios with long-duration options.

The Corolla vs Lotus Analogy
Low Delta/Gamma/Vega = Toyota Corolla
Predictable, slow, reliable
Selling 0.15–0.20 Delta CSP = high POP, low stress
High Delta/Gamma/Vega = Lotus Exige
Exciting but risky
Buying weekly calls, ATM options, chasing earnings, over leveraging using margin.
If you want to keep using the Wheel Strategy sustainably, keep yourself in Corolla territory: consistency > excitement.

What’s Next: Convexity with LEAPS
In the next lesson, we’ll show how allocating a small % of the portfolio to high‑conviction, long‑dated LEAPS can add convexity to an otherwise steady Wheel approach. The idea is simple: keep most capital in “Corolla mode” (consistent premium selling), but use a small, bounded slice for asymmetric upside—the Lotus—without the risk of blowing up. We’ll cover sizing rules, strike and tenor selection, macro considerations, and how to pair LEAPS with your CSP/CC flow so drawdowns remain controlled while upside stays open.
That’s the barbell: use consistent premium from CSP/CC income to stay solvent and compounding, then dedicate a small slice to high‑conviction LEAPS for asymmetric payoff. Income smooths drawdowns and funds mistakes; LEAPS create scalable spikes in portfolio value without levering the whole book—your Corolla carries you, the Lotus only uses bounded capital.